Abstract:
This investigation provides an opportunity to use realtime data
being collected by scientists who are working on the cutting edge
of space science. In a science classroom, the investigation can
be tied in with a unit on basic atomic structure, states of matter,
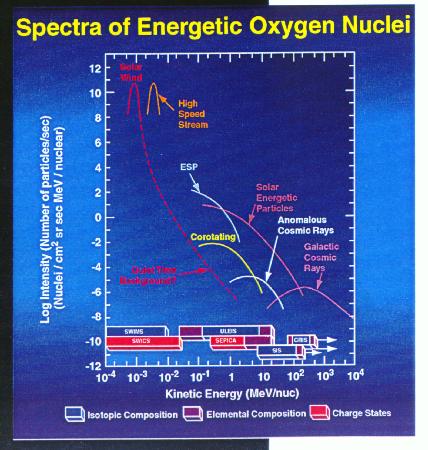
or space science. In a mathematics (algebra) classroom, the investigation
may be used to show a practical application of logarithmic plots.
In part one of this investigation the learner will become familiar
with the Advanced Composition Explorer (ACE) spacecraft and the
scientific goals of the ACE mission. In part two of the investigation
the learner will interpret ACE Browse Data Plots and speculate
on the type of solar activity being measured. An explanation of basic atomic structure and the ACE project and can be found in the "Composition of Matter, Atomic Structure" Education Brief.
Outcomes:
Suggested Grade Level & Duration:
Grades 9-12; 1 fifty-minute period.
Materials:
The learner will need a computer with internet access and an attached
printer to print a copy of the worksheet and/or procedure for the investigation if so desired.
Background - Procedure - Standards - Credits