Background: (Terms shown in bold are defined in the glossary.
The learner can access the Glossary by clicking on the terms.)
The Earth is constantly bombarded with a stream of accelerated particles arriving not only from the Sun,
but also from the interstellar medium and galactic sources. Study of these energetic
particles will contribute to our understanding of the formation and evolution of the universe as well as
the astrophysical processes involved. The Advanced Composition Explorer (ACE)
spacecraft is sampling lower-energy particles of solar origin and higher-energy galactic particles with a
collecting power 10 to 1000 times greater than similar past experiments.
From a location
approximately 1/100 of the distance from the Earth to the Sun, ACE is performing measurements of
cosmic ray particles over a wide range of energies and nuclear masses. ACE
provides near-real-time solar wind information. When reporting space weather ACE provides an advance warning
(about one hour) of geomagnetic storms, which can overload power grids, disrupt communications
on Earth, and present a hazard to astronauts.
Changes in the Sun’s output of visible light,
invisible electromagnetic radiation, solar wind (ions), and solar energetic particles (SEPs),
is collectively classified as solar activity. A large percentage of the particles which travel
toward Earth from the Sun are in the plasma state. These charged ions are the
main constituent of the solar wind. These moving ions have small
magnetic fields surrounding them just like all moving electrical charges. One of the main topics that
is of interest to scientists is the interaction of the overall magnetic field generated by these ions
with the Earth’s magnetosphere (magnetic field). This interaction is rather
complicated. The solar wind particles approach the magnetosphere. Since charged particles tend to flow along
magnetic field lines, the field lines are the “highways in the sky” for charged particles.
The net result is that the Earth’s magnetosphere normally protects us from the stream of high energy
particles in this way. When solar activity occurs, the magnetosphere may become distorted by it, and
the “highways in the sky” may shift to new locations causing a
geomagnetic storm.
The composition of the solar wind can be altered by solar
activity like solar flares, coronal mass ejections (CMEs), and solar plumes. The
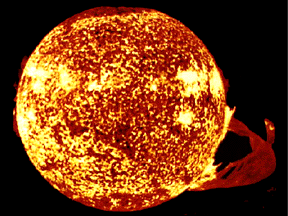
solar flares are tremendous explosions in the Sun’s atmosphere. These explosions
are believed to result from the rapid release of energy stored in the magnetic fields around sunspots
(darker and cooler areas on the Sun’s surface created by expanding loops of plasma). These
solar flares result in the acceleration of ions of elements such as carbon, nitrogen, oxygen, neon,
magnesium, silicon, and iron. These accelerated particles are called solar energetic
particles (SEPs) and are classified as solar cosmic rays. The largest solar flares are normally
associated with coronal mass ejections (CMEs). These CMEs are tremendous eruptions of mass
from the Sun. These ejections expand as they climb and heat the solar plasma to tens of
millions of degrees. These CMEs eventually accelerate electrons, protons, and heavy nuclei to velocities
approaching the speed of light. The solar plumes are feathery jets that extend
from near the Sun’s poles to more than 13 million miles into space. These plumes expel high-speed
streams of plasma (that can reach one million degrees) from the corona.
The interaction of the the various solar events with each other creates a very complicated system. The frequency of solar activity generally follows the well-documented eleven-year solar activity
cycle. At its peak their may be several tens of flares per day. The CMEs occur only a few times
during the period of maximum solar activity.
Glossary:
ACE -
(Advanced Composition Explorer) NASA spacecraft launched in August of 1997 with the purpose of sampling
the matter that comes near the Earth from the Sun, the space between the planets, and the Milky Way galaxy beyond the solar system
acronym - a word formed from the initial letter(s) of each
successive part of a phrase
alpha particle - positively charged particle consisting of two protons and two
neutrons
atomic number - represented by Z, equals the number
of protons in the nucleus of an atom
cosmic rays - particles and high-energy light that
bombard the Earth from anywhere beyond its atmosphere
coronal mass ejections (CMEs) -
huge ejections of mass from the Sun; they are balloon- shaped bursts of solar wind rising above the solar corona,
expanding as they climb; solar plasma is heated to tens of millions of degrees, and electrons,
protons, and heavy nuclei are accelerated to near the speed of light
electron - negatively
charged particle, one of the three major building blocks for atoms
electron volt -
the energy acquired by an electron as a result of moving through a potential
difference
of 1 volt
flux - measurement which describes the rate of particle flow
geomagnetic storm - magnetic storms on earth caused by solar activity; they cause the auroras,
surges in power lines, and interference of radio and TV signal transmissions
ions - an atom that carries a positive or negative electrical charge as a result of having lost or
gained one or more electrons
interstellar medium - the seemingly empty space between stars
that is actually composed of particles from a variety of sources
isotopes -
different forms of an element (depending on the number of neutrons)
kiloelectron volt
(keV) - unit of electrical energy equivalent to 1000 electron volts
logarithmic scale - a scale
based on the fact that powers or exponents of base numbers are added when multiplying and subtracted when
dividing; math functions that range over a broad scale of magnitudes are usually graphed with a
logarithmic axis
magnetic field - a region of space near a magnetized body or electrical current
where magnetic forces can be detected
magnetometer - instrument designed to measure magnetic field strength and/
or direction
mass spectrometer - instrument designed to measure the mass of atomic and subatomic
particles
megaelectron volt (MeV) - unit of electrical energy equivalent to one million
electron volts
plasma - a fourth state of matter-- not a solid, liquid, or gas; in a plasma, the electrons are pulled free from the
atoms and can move independently; the individual atoms are charged, even though the total number
of positive and negative charges is equal, maintaining overall electrical neutrality
proton - positively charged particle, one of the three major building blocks for atoms; the
number of
protons found in an atom’s nucleus determines what element
is present
solar energetic particles (SEPs) - are atoms that are associated with solar flares;
SEPs
are a type of cosmic ray that move away from the Sun due to plasma heating,
acceleration, and numerous other forces; on the scale of cosmic radiation, SEPs have relatively low energies
solar flare - enormous explosion of gas in the solar atmosphere resulting in: a sudden
acceleration of particles, the heating of plasma, and the eruption of large amounts of solar mass
solar plumes - feathery jets that extend from near the poles of the Sun to more than 13 million
miles into space
solar wind - the plasma of charged particles(protons, electrons, and heavier
ionized atoms)
coming out of the Sun in all directions
universal time (UT) - method of measuring time referenced to Greenwich, England; the time
is kept using a zero to 24 hour scale with zero equaling midnight; also known as
Greenwich Mean Time (GMT), or Zulu time
Procedure & Questions:
PART ONE: INTRODUCTION
1. Access the ACE Project page at http://www.srl.caltech.edu/ACE/
2. Scroll to the bottom of the page where you will see a list of the instruments found on the
ACE spacecraft.
3. The names of the ACE instruments are actually acronyms. For each
of the instruments determine what the acronym stands for and list its meaning on your worksheet.
4. From the acronym names for the ACE instruments it is possible to determine what
each instrument measures. On your worksheet make a list of all the types of particles which ACE instruments
can detect.
5. Using the accompanying educational brief, glossary, and background
information to provide a description for each of the particles which you listed in procedure #4.
6. Access a list of the ACE Scientific Goals at the following web address http://helios.gsfc.nasa.gov/ace/ace_science.html
7. Study the goals to learn what scientists hope to learn from the data collected by the instruments.
Summarize one of the four broad goals on your worksheet.
PART TWO: ANALYZING ACE RTSW PLOTS
1. Access the ACE Project page at http://www.srl.caltech.edu/ACE/
2. Click ONLINE DATA.
3. Click the Real
Time button. (This takes you to the ACE real time solar wind page.)
4. Click on
“ACE Real-Time Solar Wind (RTSW) Data”
5. Click on “ACE Plots” found
below Real Time Data on the left of your display. (You can now select the RTSW data (ACE instrument)
which you want to plot and the window scale (time) for your plot. The first window below Select
ACE RTSW Data to Plot allows you to choose which ACE instrument data set you want to plot. The second
window below Select ACE RTSW Data to Plot allows you to choose the time interval you want to look at.)
6. To begin, click and hold the arrow in the first window below Select ACE
RTSW Data to Plot.
7. Drag down until you highlight EPAM electrons. (For starters
we will not alter the “Plot Window Scale”)
8. Click on the Start Plot
button to begin plotting EPAM electron data over the last 24 hours.
9. Answer
the following questions on your worksheet.
WORKSHEET QUESTIONS FOR PART TWO
1. This plot shows electron flux detected by EPAM over two energy ranges. The unit for
energy used here is the kiloelectron volt (keV). List on your worksheet the range of energies detected for
:
a) the low energy electrons on the plot .
b) the high energy electrons on the plot .
2. The x-axis on the plot corresponds to the time. The unit for
time used here is universal time (UT ) in hours. Each small segment of the x-axis represents 10 minutes
of time. What day and time correspond with the highest electron flux over the past 24 hours for:
a) the lower energy range of electrons?
b) the higher energy range of electrons?
3. What day and time correspond with the lowest electron flux over the past 24 hours for:
a) the lower energy range of electrons?
b) the higher energy range of electrons?
4. The y-axis is a measure of the flux for the electrons detected by EPAM over the past 24 hours. List on your worksheet the range
of the electron energy flux (see HINT below) for:
a) the lower energy range of electrons?
b) the higher energy range of electrons?
HINT : The y-axis is shown as a logarithmic plot. The lower dashed white line which extends across the plot corresponds
with 100 particles and is shown as 1.0 E +02. This is called E-notation or exponential notation. The E +02 represents ten raised to the
power of two and is normally written as 1.0 x 10². The next short line on the y-axis above it corresponds with
200 particles and is shown as 2.0 E +02, then 300 particles is shown as 3.0 E +02, and so on. The line at the top corresponds with
10,000 particles and is shown as 1.0 E +04. (For a more complete explanation of logarithmic plots access
the following link.)
http://mentor.lscf.ucsb.edu/mcdb108a/tw-lig/logarithmic-algebra.htm
5. From the EPAM plot, what relationship do you see between the electron flux and the energy associated
with the electrons?
6. Do you see any unusually high peaks in your plot? Use
information found in the Background for the investigation to speculate what may
have caused unusually high peaks (or the lack of them).
7. Close your window and
reset your data plot for EPAM Protons over the last seven days. To do this:
- Click and hold the arrow in the first window below Select ACE RTSW Data to Plot
.
- Then drag down until you highlight EPAM protons.
- Then click and hold on the arrow in the second window below Select ACE RTSW Data to Plot.
- Drag down until you highlight 7 Days (1-min or 5- min data).
- Click Start Plot.
7a. How many
different proton energy ranges does the EPAM instrument detect?
7b. From
the EPAM plot what relationship do you see between the proton flux and the energy associated with the
protons?
7c. Does there appear to be a direct correlation between the peaks
in proton flux for different energy ranges? What might explain this correlation?
8. From you knowledge of the kinds of disturbances which cause the solar winds (see glossary), do your graphs
indicate the possibility of any of these occurrences? Explain your answer.
9. Close your window and reset your data plot for EPAM Electrons and Protons over the last seven days and
start the plot.
a. Do the peaks in the electron fluxes and the peaks in the proton fluxes
seem to correlate?
b. What might this indicate?
10. Access the following link http://www.srl.caltech.edu/ACE/ASC/solar_evnts.html to see ACE data detected during SEP events in November
1997. Click on the SIS site and answer these questions.
a. What elements’ ions were
detected during the events shown?
b. Which ion seems to have been present in the greatest quantity?
11. Access ACE Browse Data at the web address below.
http://www.srl.caltech.edu/ACE/ASC/browse/brws_grphs.html
On the Element Fluxes chart Click on the light blue rectangular section found to the right of Fe, Si, Mg,
and Ne and above 10 MeV/nucleon. This links you to SIS data on fluxes for those cosmic ray
isotopes. The graph which appears indicates the flux for ions with an atomic number (Z) greater than 10.
Scroll down until you see the graph for “Daily averages since launch”. Scan the graph
to locate the SEP event for November 1997 discussed in question number 10 above.
a. Do you see any other significant events which SIS has detected since that event.
b. Describe any significant events in terms of the day the event occurred, the magnitude of the event
(# of particles), and its relative size to the November 1997 event.
c. According to text
associated with the site in question number 10 above, the large SEP event for November 1997 apparently marks
the beginning of the transition to the next solar maximum. Does your analysis of SIS data
since then support that conclusion? Support your answer.
Coding:
Maryland Core Learning Goals (Science):
2:1:2, 2:2:1, 2:3:1
National Standards (Science)
: Physical Science grades 9-12, standards #1, 2, 6
Earth and Space Science grades 9-12, standard #4
National Standards (Geography): standard #8, indicator 2
National Standards (Mathematics): standards #1.2, 2.6, 3.1, 4.4, 5.2, 6.1, 6.6, 10.1
Investigation Discussion and Questions
1. What types of problems do you think scientists might run across as they try to interpret data from missions
such as ACE? Include in your discussion thoughts about:
- trying to interpret the data
- computer software
- computer hardware
- conflicting theories concerning the topic
- etc.
Feedback:
Goddard Scientists: Dr. Eric Christian <cosmicopia@cosmicra.gsfc.nasa.gov>,
Dr. John Krizmanic <cosmicopia@cosmicra.gsfc.nasa.gov>
ACE Outreach Specialist:
Beth Barbier<cosmicopia@cosmicra.gsfc.nasa.gov>
Credits:
Daniel Hortert GESSEP Program
Pat Keeney GESSEP Program
Dr. Eric Christian ACE Deputy Project
Scientist
Dr. John Krizmanic Astroparticle Physicist
Beth Barbier ACE Outreach Specialist