Space Weather and YOU! Introduction 2
http://www.nas.edu/ssb/cloud.gif
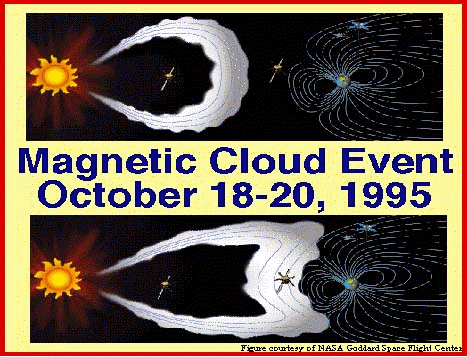
Space Weather
Space Weather and YOU! Introduction 2
http://www.nas.edu/ssb/cloud.gif
Space Weather
Abstract:
When was the last big solar event? Are these events regular and
predictable, or random? This investigation provides an opportunity
to see and use realtime data collected by scientists who are working
on the cutting edge of space science. The investigation can be
tied in with Earth Science content on the Sun and solar system
structure, spacecraft and what they do, and integrates graphing
and analyzing graphically-represented data.
This investigation can be adaptable to a variety of learners.
In this investigation the learner will explore the relationship
between solar storms and solar cycles, like the sunspot cycle.
The accompanying Educational Brief ACE Mission -- Space Weather provides an explanation of space weather and its effects. The
learner will explore web sites related to space weather and its
resources. The learner will also access plots of live data and
recorded data, and be challenged to relate the two.
Outcome:
1. The learner will calculate averages for a given quantity in
a given set of data, determine the best way to graphically represent
the data, and graphically represent the data either by hand or
with the assistance of a computer.
2. The learner will infer relationships between two data sets,
and list those relationships.
3. The learner will establish a possible cause and effect relationship
between sunspot cycles and solar weather events
Suggested Grade Level & Duration:
Grades 9-12 (appropriate as a math application of data representation);
one fifty-minute period
Materials:
Relevant links: